
Teaching Climate Change During Statistics and Research Methods
by Kimberly A. Barchard, Kaelyn Griffin, Jaedyn Billerbeck, and Luke Reyes
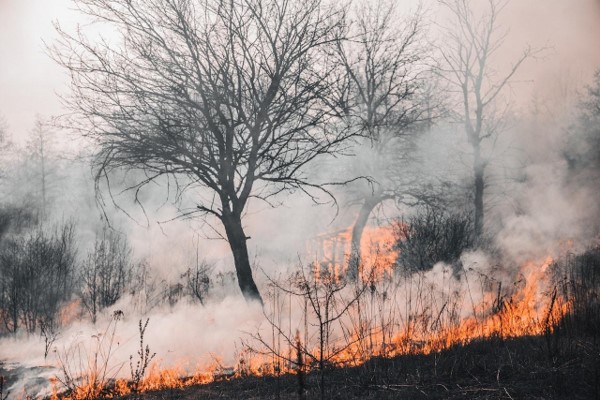
Climate change is the largest existential threat facing college students today, leading to increased risks of fires, floods, and hurricanes. Teachers can prepare students to face and mitigate climate change by discussing it in their classes. Statistics teachers have particular flexibility because they can change the topics of their assignments without changing the textbook or the methods being taught. However, incorporating climate change into a course is easier if the teacher can use (or adapt) existing assignments or datasets. Therefore, we created a large dataset with multiple psychological variables related to climate change, along with a set of 10 assignments that use this dataset.
The study included four measures: the 22-item Psychological Responses to Climate Change Scale, the first 13 items of which are referred to as the Climate Change Anxiety Scale (Clayton & Karazsia, 2020); the 11-item Climate Change Hope Scale (Li & Monroe, 2017), the 12-item Climate Change Trust Scale (Barchard, Hoffman, et al., 2021); and the 77-item Climate Change Action Inventory (CCAI; Barchard, Okagawa, et al., 2021), which measures the frequency of actions to reduce climate change. The CCAI contains eight domains: Energy Conservation (10 items), Water Conservation (8 items), Transportation (11 items), Climate-Friendly Food Choices (six items), Reducing Food Waste (8 items), Climate-Friendly Purchasing Choices (14 items), Recycling (11 items), and Removing Carbon from the Atmosphere (9 items). The CCAI includes direct actions, such as “Take shorter showers,” and “Eat leftovers,” as well as indirect actions, such as “Encourage others to recycle” and “Give time or money to organizations working to reduce purchases.” Thus, the dataset could be used to introduce students to a wide variety of psychological areas that are relevant to climate change and can be used to teach both introductory and advanced statistical analyses.
Using this dataset, we created a set of assignments to teach introductory statistics. These assignments use the statistics program Jamovi, which is free, open-source, and easy to use. Thus, these assignments can be used during in-person or online classes, with students in any location. With Jamovi, these assignments have been used in three sections of Introductory Statistics and were well received by the students and by the teaching assistants who supervised them.
We created 10 Jamovi assignments:
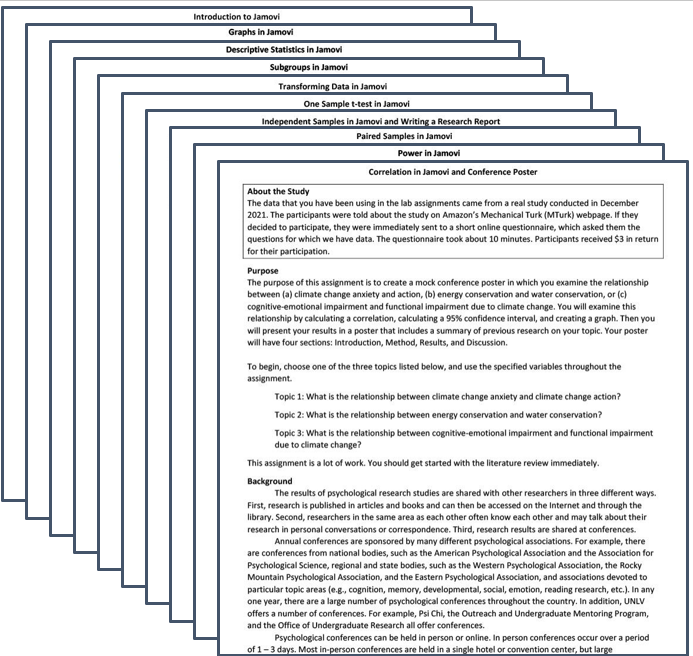
- Introduction to Jamovi
- Graphs in Jamovi
- Descriptive Statistics in Jamovi
- Subgroups in Jamovi
- Transforming Data in Jamovi
- One Sample t-test in Jamovi
- Independent Samples t-test in Jamovi and Writing a Research Report
- Paired Samples in Jamovi
- Power in Jamovi
- Correlation in Jamovi and Conference Poster
Each assignment is independent, so they can be used individually or in any order.
The last assignment asks students to create a complete conference poster. First students select one of three research topics. Then they conduct a brief literature review, write Introduction, Method, Results, and Discussion sections, and create a formatted poster in Google Slides. Thus, this assignment helps students to build their research and writing skills, while empowering them to follow their own interests in climate change.
All ten assignments teach about climate change in two additional ways. First, students actively engage with the material. For example, students can determine if increased climate change anxiety is associated with increased action or if people who conserve electricity also conserve water. Second, each assignment provides links to supplemental materials. For example, the one sample t-test assignment provides links to a TED talk on Climate Change and the United Nations website Act Now
 The assignments and dataset can be downloaded from the Open Science Framework, then shared with students in whatever method is most convenient. The dataset is given in both Jamovi and Excel format for easy compatibility with programs like R and SPSS. For example, we have used this dataset with R to teach exploratory factor analysis, confirmatory factor analysis, and moderation analysis
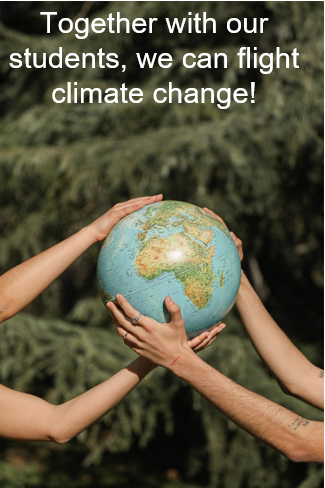
If you teach statistics or research methods, you can use our or adapt our materials for your class. If you do not teach statistics or research methods, you can share our materials with others who do. Together with our students, we can fight climate change.
For a video version of this material, see our SPSP 2023 presentation.
References
Barchard, K. A., Hoffman, C. K., Okagawa, K., & Odents, O. (2021). Climate Change Trust Scale. [Unpublished psychological test]. Available from kim.barchard@unlv.edu
Barchard, K. A., Okagawa, K., Hoffman, C. K., & Odents, O. (2021). Climate Change Action Inventory. [Unpublished psychological test]. Available from kim.barchard@unlv.edu
Clayton, S. C. & Karazsia, B. T. (2020). Development and validation of a measure of climate change anxiety. Journal of Environmental Psychology, 69, 101434. https://doi.org/10.1016/j.jenvp.2020.101434
Li, C., & Monroe, M. C. (2017). Development and validation of the Climate Change Hope Scale for High School Students. Environment and Behavior, 1 – 26. https://doi.org/10.1177/0013916517708325
 Kimberly A. Barchard is a Professor in the Department of Psychology at UNLV and is the Director of the Interactive Measurement Group. She works to empower lab members to accomplish their personal and professional goals, particularly through the development of leadership, research, and organizational skills.
 Kaelyn Griffin is a fourth-year clinical psychology doctoral student at UNLV. Her research primarily focuses on religiosity, religious trauma, compulsive sexual behavior, and pornography use. She plans to pursue a career in clinical work after graduate school.
 Jae Billerbeck recently graduated this Spring with a B.A. in Psychology. She will be attending UNLV’s School Psychology Ed.S. program this upcoming Fall. After graduate studies, Jae hopes to work in schools to help students through behavioral issues, and also work with special education programs.
 Luke Reyes joined the Interactive Measurement Group in Spring 2022. During his time in the lab, he co-authored three conference posters, created and presented many lab workshops, organized our climate change dataset, and served as a teaching assistant for Introductory Statistics. He is currently a senior, majoring in psychology with plans to pursue a PsyD in graduate school.